U3 is the official unemployment rate used by the Bureau of Labor Statistics (BLS) in the United States. It represents the total number of unemployed people as a percentage of the labor force.
Identifying who is unemployed and who is in the labor force is necessary to understand U-3. The US labor force includes employed and unemployed civilians over 16 years old living in the United States. To be considered unemployed, a person must be actively looking for a job or have actively looked for a job within the past four weeks.
Consider Chef John. He was laid off during the COVID-19 pandemic. As long as he actively searched for a job, the Bureau of Labor Statistics (BLS) considered him unemployed. However, Chef John became discouraged and discontinued his search after four weeks. The BLS did not consider Chef John unemployed while he was discouraged. Even though Chef John wanted to work, he was no longer part of the labor force because the labor force only includes those who are working plus those who are unemployed. However, after Chef John accepted a part-time job for two hours a day, he was considered employed and part of the labor force, even though he would have preferred full-time employment.
Generally, U-3 is directly related to economic growth. Businesses hire workers to meet the increased demand for goods and services. The demand for workers raises wages, enticing more people to enter the workforce. During contractions, businesses lay off workers, which increases the unemployment rate. However, U-3 could conceivably decrease during a severe recession if workers become discouraged and leave the labor force. It is also possible for U-3 to increase during an expansion if people reenter the labor market as the economy improves. It takes time to find a job, and these people are considered unemployed until they are hired.
Many economists believe U-3 was not a true reflection of the employment situation during the COVID pandemic because it does not consider discouraged workers or those who accept part-time positions but would prefer to work full-time. The U-6 rate, however, includes these workers.
U-6 is a measure of unemployment that includes workers who are marginally attached to the labor force and part-time workers who would prefer to work full time. Its mathematical formula is:

Marginally attached workers include people who are available and want to work. They have looked for work sometime in the past twelve months but not in the prior four weeks. Because they are not actively looking for a job, the BLS does not include marginally attached workers in U-3. Chef John would have been included in U-6, but not U-3, when he became discouraged after several months.
During the COVID-19 pandemic, many, like Chef John, may have accepted a part-time job for just an hour or two a day. The BLS considers them employed. Like marginally attached workers, people who accept a part-time job because they cannot secure a full-time job are included in U-6 but excluded from U-3.
The graph below shows the relationship between U-3 and U-6 from January 2020 to May 2024. For a more recent graph, visit our latest employment blog in the US Economy category.
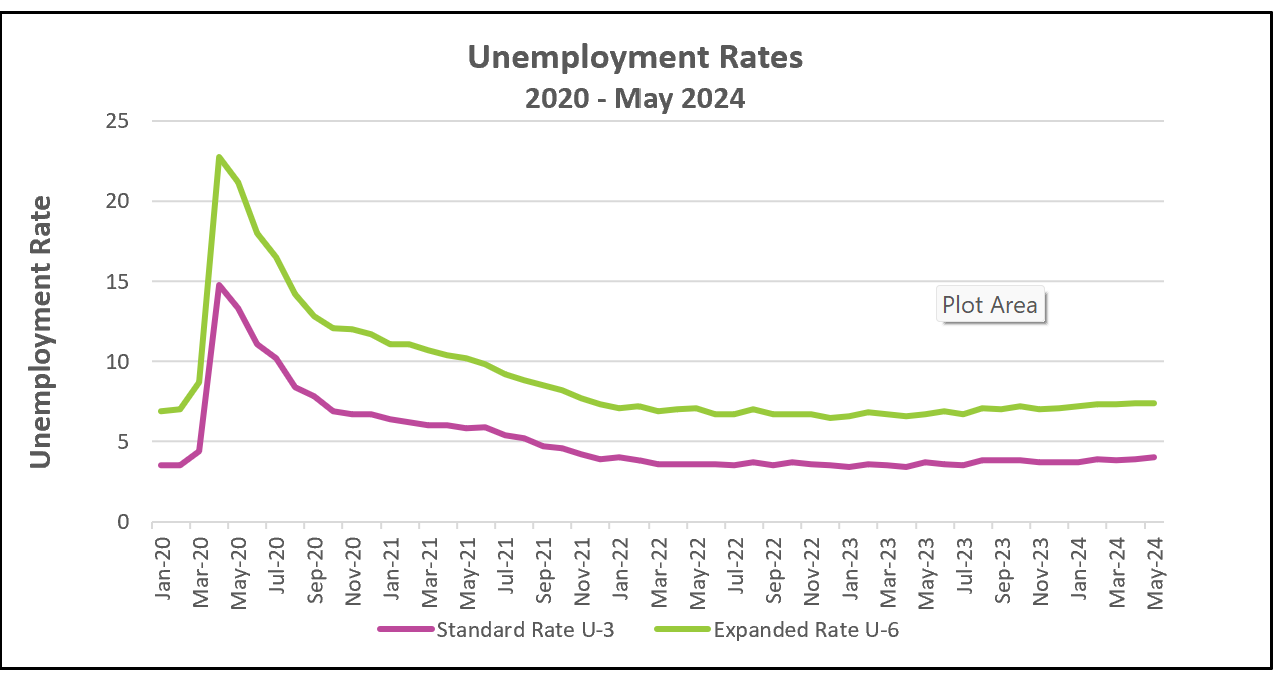
Reviewing U-3 and U-6 together provides a more accurate picture of the employment situation. If the spread between U-6 and U-3 is widening, the economy is likely deteriorating. While U-3 may be increasing, if U-6 is rising at a faster rate, it indicates that more people have become discouraged and are leaving the labor force. This circumstance restrains the increase in U-3 while pushing up U-6.
An improvement in the employment situation will narrow the spread between U-3 and U-6. Positive economic news encourages formerly discouraged workers to reenter the workforce. As these individuals return to actively seeking employment, the BLS would reclassify them from not being counted as unemployed to being unemployed, adding them to U-3. While U-6 remains the same, U-3 increases, thus reducing the spread between the two unemployment measures.
The table below compares U-3 and U-6 during the COVID-19 pandemic in 2020. As COVID-19 escalated, governments implemented containment measures to limit social interaction, leading to temporary closures of many businesses and causing over 20 million job losses. Many people accepted part-time jobs, while others became discouraged and exited the workforce. As expected, both U-3 and U-6 increased, and the spread between U-6 and U-3 widened from 4.34% to 8.08%. The economy was heading in the wrong direction.
Between April and September, as cities began to lift some containment measures, discouraged workers started actively seeking employment again. This contributed to decreases in both U-3 and U-6. The economy’s recovery was reflected in the narrowing of the spread between U-3 and U-6, which decreased from 8.08% to 4.98%.
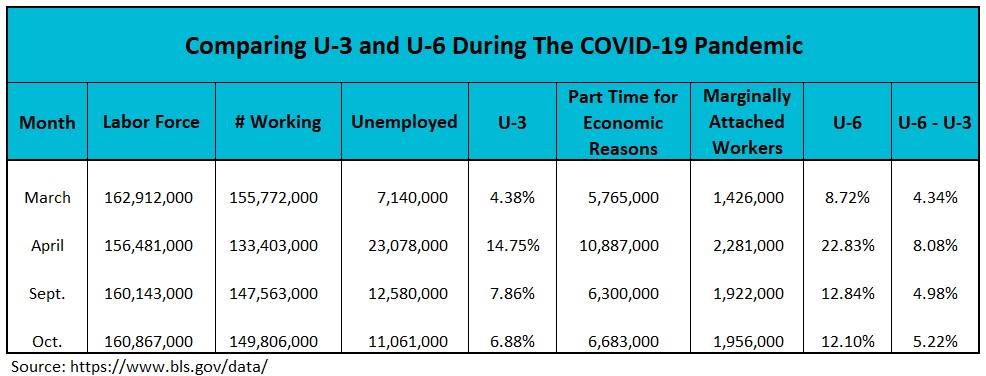
In October, unemployment dropped by one percent. While this significant decrease was encouraging, most economists believe it did not provide a clear picture of the employment situation. COVID cases continued to increase exponentially. About 25% of the decline in U-3 was attributable to individuals reentering the workforce and accepting part-time jobs. Concurrently, the number of discouraged workers also increased. The rise in the spread between U-6 and U-3, from 4.98% to 5.22%, reflects this mixed news.
The Bureau of Labor Statistics publishes these figures using data collected from monthly surveys of 60,000 randomly selected households.
Business Cycles
Fiscal Policy – Managing An Economy By Taxing and Spending
Gross Domestic Product – Measuring An Economy’s Performance